| Category | Population | Percentage | GDP.per.capita |
|---|---|---|---|
| World | 7,950,946,801 | 100.00 | 12,687.74 |
| High Income | 1,244,364,814 | 15.65 | 49,607.25 |
| Middle Income | 5,974,552,342 | 75.14 | 6,687.87 |
| Low Income | 703,727,949 | 8.85 | 750.47 |
| Note: | |||
| Source: World Bank, World Development Indicators |
ECON 4643: Development Economics
Lecture 1: Introduction
Introduction and housekeeping
Course
https://github.com/Harounan/ECON4643
You’ll soon receive access to a semester-specific copy of this repo, where we submit assignments, upload presentations, etc.
Me
Professor (Economics, Spears School of Business)
You
- A quick roundtable of names, major/minor/interests, and classes in economics.
class: inverse, center, middle name
Syllabus
(Read the full document here )
Course Overview
Economic Development
Economic Development is about raising the income, well-being, and capabilities of peoples everywhere.
Raising one’s income allows her the means to obtain more medical care, food, goods, or other necessary items. -Whether or not she is able to obtain those goods given the means is another question.
A person’s well-being is closely related to her quality of life:
life expectancy and health for example.
Capabilities relates to the idea of whether or not one is actually capable of achieving a certain goal. For example, is one able to buy a bicycle if one can afford it?
Development Economics
Development Economics is a scientific discipline concerned with the economic situation of low-income countries
Development Economics intersects with (almost) all other fields of economics
microeconomics
macroeconomics
international economics
labor economics
health economics
agricultural economics
urban economics
…
Development Economics
Development economics: study of economies that do not fit many of the basic assumptions underpinning economic analysis in high-income countries
well-functioning markets,
perfect information,
perfect information,
low transaction costs.
Most welfare and policy prescriptions of economic analysis fail, When one or more of these assumptions do not hold
Need new tools
Normative and Positive Objectives of Development
The basic positive questions addressed by development economics are:
- What explains the very low standard of living of most people in the world? (as we will see, standard of living is measured)
- What can be done to raise the standard of living of the poorest in the world?
Normative questions can be different 1. Growth of aggregate material consumption as measured by GDP per capita 2. Reduction of income inequalities within countries 3. Reduction of world income disparities 4. Reduction of absolute economic poverty in the world
World Income Inequality
There is enormous inequality in the income levels across countries.
84.34% of the world’s population lives in middle and low-income countries in 2022
75.15% in middle income countries
8.85% in low income countries
The average income in low-income countries is $1,000 per capita and $6777 in middle income countries.
Compare that with the average per capita income in the richest countries which is over $45,000.
Why Use Per Capita Income?
Is per capita income a decent measure of the level of well-being?
Well-being is multifaceted but, with regards to literacy, life expectancy, and infant mortality, per capita income seems to be related to better outcomes.
Can (and) will use other indicators
e.g, Life expectancy: it is a good measure of well-being because a longer life expectancy tends to mean one is in better health, not suffering from hunger, and has decent living conditions.
Caution: Problems of Cross-Country Comparisons
These figures are obtained using the “exchange rate” method.
This method uses the official rates of exchange between local currency and a “common or benchmark” currency, usually the US Dollar as valued in a given year
The numbers used to generate this figure should then be interpreted with some caution:
A large proportion of earnings are generated for self-consumption in developing countries.
Underreporting of income is common
Does not account for differences in cost of living
Prices for goods may not be appropriately reflected in the exchange rates
Non-traded goods, such as services and infrastructure, do not effect the exchange rate.
This is because exchange rates (which are simply prices for other currencies) depend only on commodities that cross international borders.
In poor countries, because they are poorer, services and other non-traded goods are likely to be much cheaper than in richer countries.
The “exchange rate” method tends to underestimate the real incomes of poorer countries.
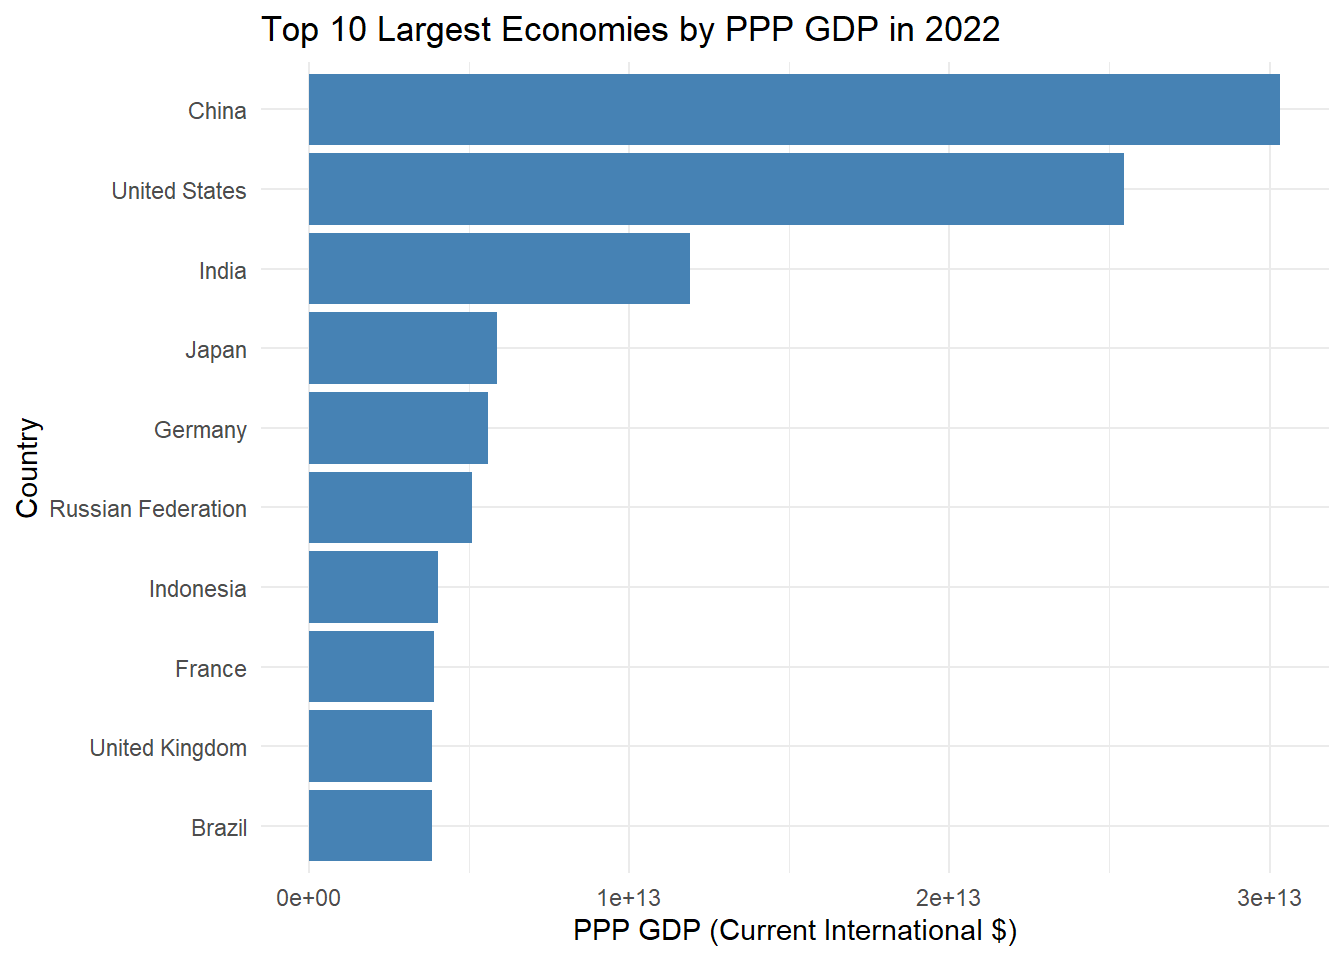
Purchasing Power Parity (PPP)
The PPP is the ratio of a country’s domestic currency expenditures to the international price value of its output.
Calculating the PPP involves figuring out the bundle of goods that an average person in a country consumes.
That basket is then valued in US dollars BUT the value of the basket is calculated using average world prices for the goods in the basket rather than only US prices.
Thus the PPP adjusts a country’s GNP based on the basket of goods a country consumes and the international value placed on those goods.
Using PPP to value a country’s output has a significant effect for some features and changes other features but not qualitatively
World Largest Economies by ER and PPP Methods
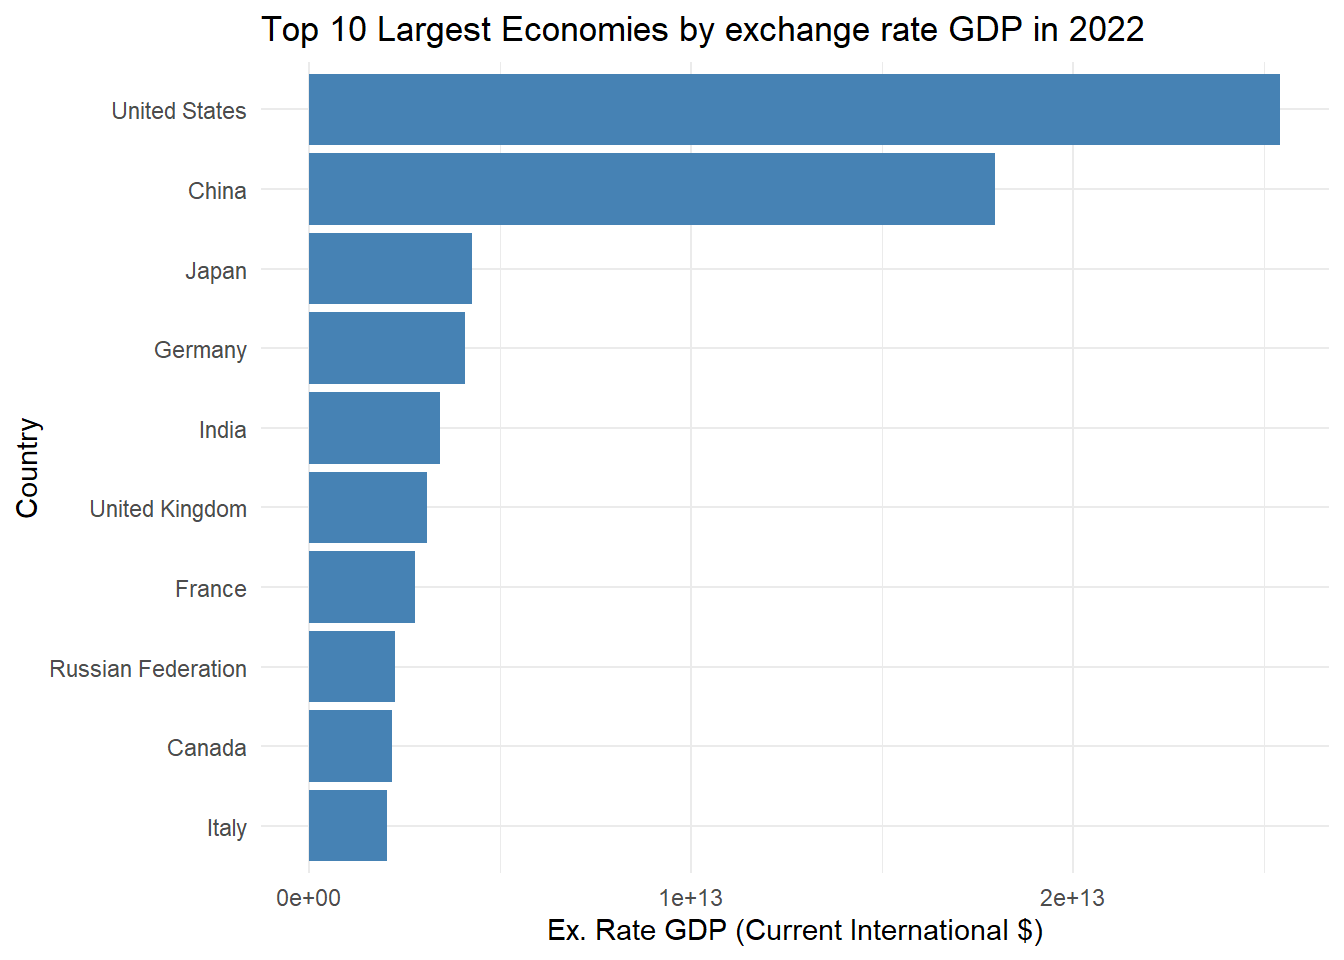
World Largest Economies by ER and PPP Methods
Beyond Income
Human Development
Many direct physical symptoms of development are measurable:
- Undernutrition
- Disease
- Literacy, or illiteracy -Does increasing wealth of a country, or a country’s GDP, has any effect on these basic indicators of well-being or if we need to be worried about other aspects of a country’s growth, such as its level of industrialization?
We will see how well per capita income and a measure of inequality do in their correlation with some basic indicators of well-being: life expectancy; infant mortality; access to safe water; adult literacy.
We’ll look at Guatemala and Sri Lanka
Income levels and distribution in Sri Lanka and Guatemala in 1993
| Country | Per cap income (1993 PPP) | Share poorest 40% | Share richest 20% |
|---|---|---|---|
| Sri Lanka | 2,990 | 22 | 39 |
| Guatemala | 3,350 | 8 | 63 |
| Note: | |||
| Source: Ray, 1997, p.26 |
- Sri Lanka is, per person, poorer than Guatemala.
- Income in Sri Lanka is, by the measures in the table, more equal than in Guatemala.
- Question: Do you think Sri Lanka or Guatemala does better on the before mentioned indicators of well-being? Why?
Human Development in Sri Lanka and Guatemala in 1992
| Country | Life expectancy (years) | Infant mortality rate (per 1000) | Access to safe water (% of pop) | Adult literacy rate (% of pop) |
|---|---|---|---|---|
| Sri Lanka | 72 | 18 | 60 | 89 |
| Guatemala | 65 | 48 | 62 | 54 |
| Note: | ||||
| Source: Ray, 1997, p. 27 |
This example suggests that inequality and not per capita income would be a better indicator of how well a country is doing - in terms of economic development.
These distributions matter in overall economic growth in the long-run
Income levels and indicators of “human development” for Sri Lanka and Guatemala in 2021
| Country | Per cap income (PPP) | Life expectancy | Infant mortality rate | Adult literacy | Access to electricity |
|---|---|---|---|---|---|
| Sri Lanka | 14,621 | 76.40 | 5.8 | 92.43 | 100.00 |
| Guatemala | 9,850 | 69.24 | 19.6 | 84.27 | 97.87 |
| Note: | |||||
| Current GNI per capita (PPP) | |||||
| Literacy in 2022 for Guatemala | |||||
| Source: World Bank, World Development Indicators, accessed on 01/24/2024 |
About 30 years later, Sri Lanka has a higher per capita income (PPP) than Guatemala
Obviously Sri Lanka grew faster, but why?
Because of the difference in income distribution in 1992?
Or (and) because of higher human development indicators in 1993?
Development Ecomics seeks to answer these types of questions
Before rushing to that conclusion let’s look at how life expectancy, infant mortality, and adult literacy relate to per capita income more broadly.
Per Capita Income and Life Expectancy
`geom_smooth()` using formula = 'y ~ x'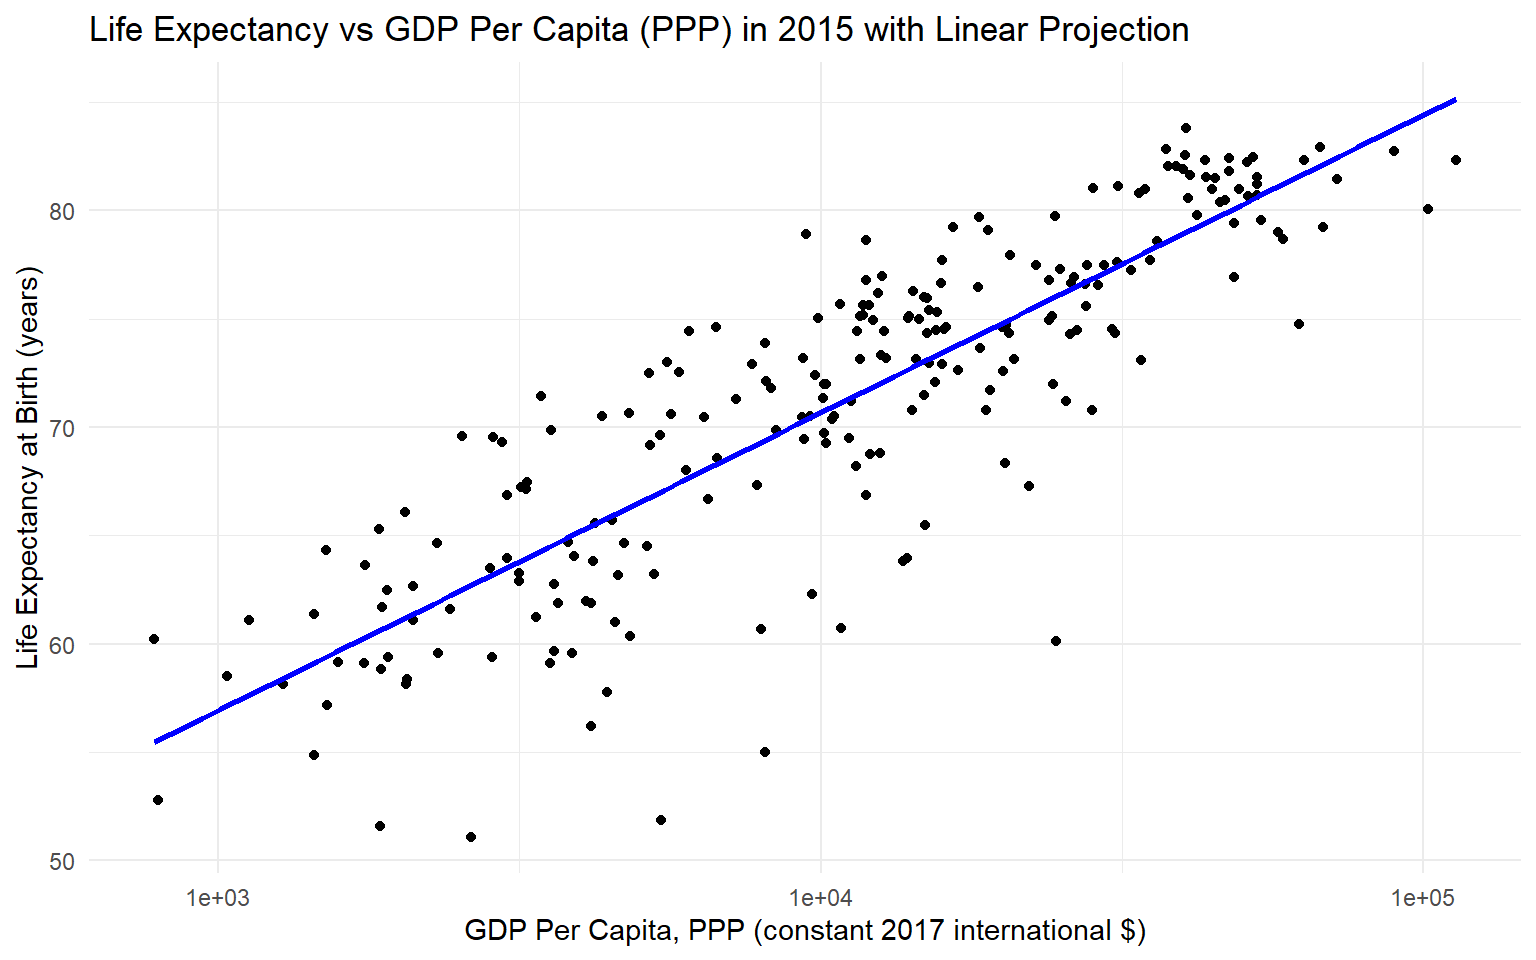
Per Capita Income and Life Expectancy
- Life Expectancy is increasing as per capita income increases.
- The relationship between life expectancy and per capita income is not exactly linear.
- Raising per capita income has more of an effect on life expectancy when the country is poorer than when it is relatively well-off.
- Per capita income is positively correlated with life expectancy.
Per Capita Income and Infant Mortality
`geom_smooth()` using formula = 'y ~ x'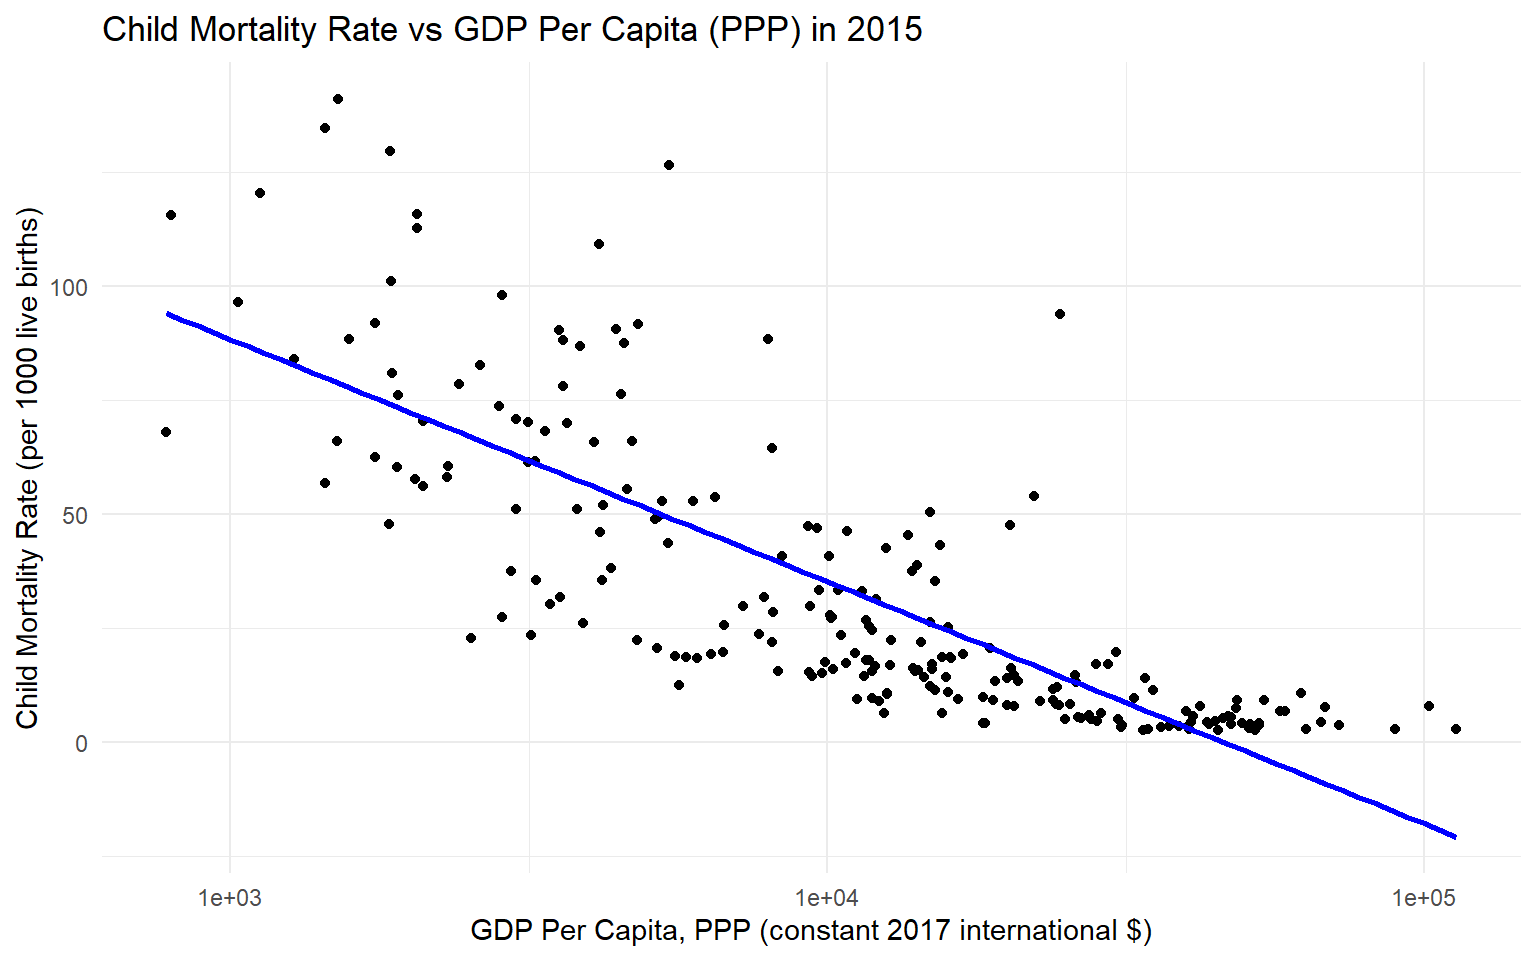
Per Capita Income and Infant Mortality
- As per capita income increases infant mortality goes down.
- This relationship, again, looks weakly non-linear.
- Per capita income is negativley correlated with infant mortality.
- Correlation is NOT causation.
- Despite this we have three very strong examples as to why per capita income can serve as a good proxy for a country’s overall well-being.
Income Growth and Human Development
While economic development is multifaceted, the preceding graphs show that the growth of a country, in terms of per capita income, is an important proxy for many indicators of well-being.
A reduction of the dimensionality of the development process is convenient for the application of analytical methods.
Data on income more easily available (at least these days)
Therefore, we will devote much effort to understand why per capita incomes are growing at different rates in different countries and how they might be able to increase growth.
Of course the models we will see in this course are not the only factors to look at when considering economic development.
e.g., Diamond’s book, Guns, Germs, and Steel lays out how geographic conditions have played a role in the much larger picture of the development of mankind.
Other disciplines (e.g., sociology, anthropology, etc.) also study economic development.
Structural Features
Structural Features
Before discussing growth, let’s get familiar with the structural differences between developing and industrialized countries.
Some of these structural differences will motivate the areas we will study
We will get a quick idea of the demographic patterns, occupational and production structure, and the distribution of the population between urban and rural sectors for developing countries.
Demographic Characteristics
- Poorer countries have both high birth rates and high death rates.
- More developed countries tend to have lower birth rates and lower death rates.
- This means that population growth is different in developing countries.
- Why should we care about population growth?
- If the population is increasing more rapidly then GNP must grow rapidly to keep per capita income constant.
- The population is relatively young.
- The Figure below shows how even fertility and per capita income are related.
`geom_smooth()` using formula = 'y ~ x'
Occupation and Production Structure
| Country Group | Perc. of workforce in agriculture |
|---|---|
| World | 27.05 |
| High Income | 3.12 |
| Middle Income | 30.47 |
| Low Income | 59.68 |
| Note: | |
| Source: World Bank, World Development Indicators |
- Agriculture accounts for a significant proportion of production in the developing world.
- Many people are subsistence farmers.
- \(58.8\%\) of the work force in low-income countries is agricultural.
- \(30.58 \%\) of the work force in middle-income countries is agricultural.
- \(3.17 \%\) of the work force in high-income countries is agricultural.
Occupation and Production Structure
`geom_smooth()` using formula = 'y ~ x'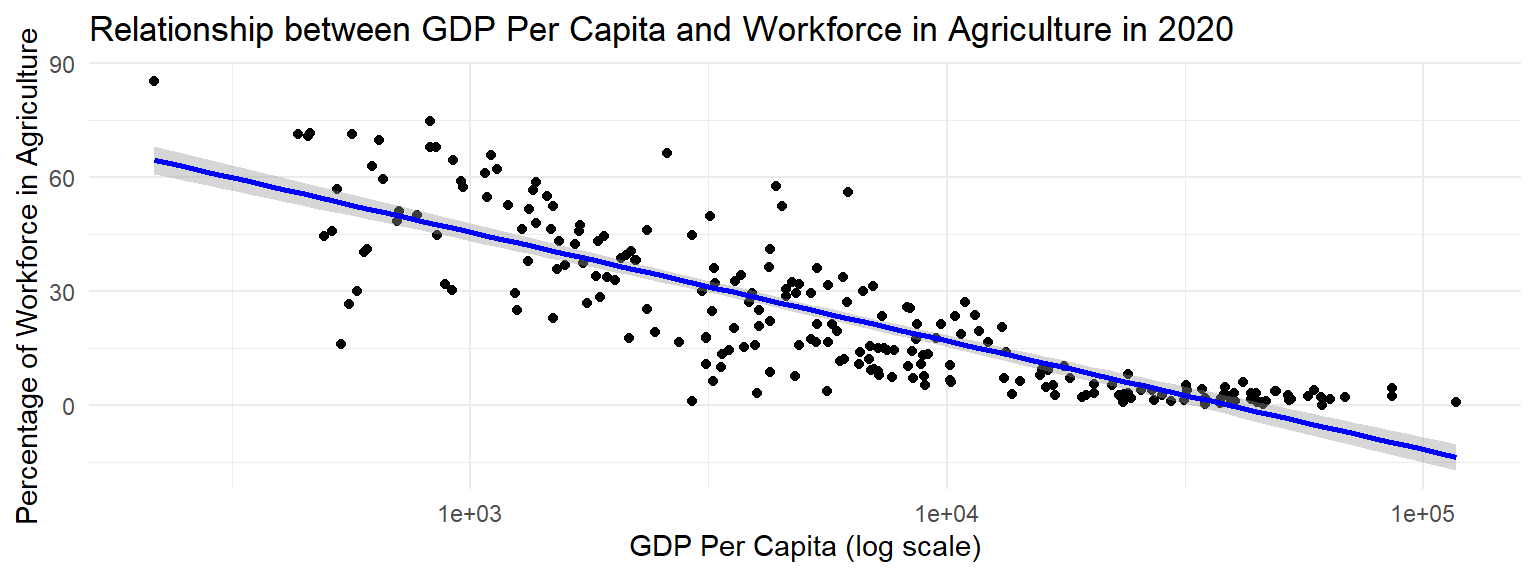
- Therefore many more people live in rural areas in developing countries.
- This means that there is a high amount of people who work in agriculture in the developing world.
Urban and Rural Sectors
Migration from rural to urbanized areas is large within developing countries.
We will model urban-rural migration later in this course.
Consider the rate of urbanization and population growth for the period of 1980-1993:
Urban populations grew by \(3.9 \%\) and the population grew by \(2 \%\) in low-income countries.
Urban populations grew by \(2.8 \%\) and the population grew by \(1.7 \%\) in middle-income countries.
Urban populations grew by \(0.8 \%\) and the population grew by \(0.6 \%\) in developed countries.
Large population migrations are still taking place in developing countries.
Structural Summary
- Developing countries are characterized by:
- High population growth.
- Being proportionally younger than developed countries.
- Large rural population.
- Large urban-rual migration.
- Being largely agricultural.
- This means, besides economic growth, we will examine issues of population, urban-rural growth, and agricultural issues.
Efficiency vs Equity
Two separate issues in developed countries
Hard to separate efficiency and equity in developing countries
Example: The capacity curve
Higher income \(\rightarrow\) better nutrition
Better nutrition \(\rightarrow\) higher capacity and higher income
If someone starts with low income and poor nutrition, hard to move up without acting first in one of these variables
Income - Nutrition
Warning in geom_point(aes(x = z_hat, y = y_values[z_hat_index]), colour = "red"): All aesthetics have length 1, but the data has 300 rows.
ℹ Did you mean to use `annotate()`?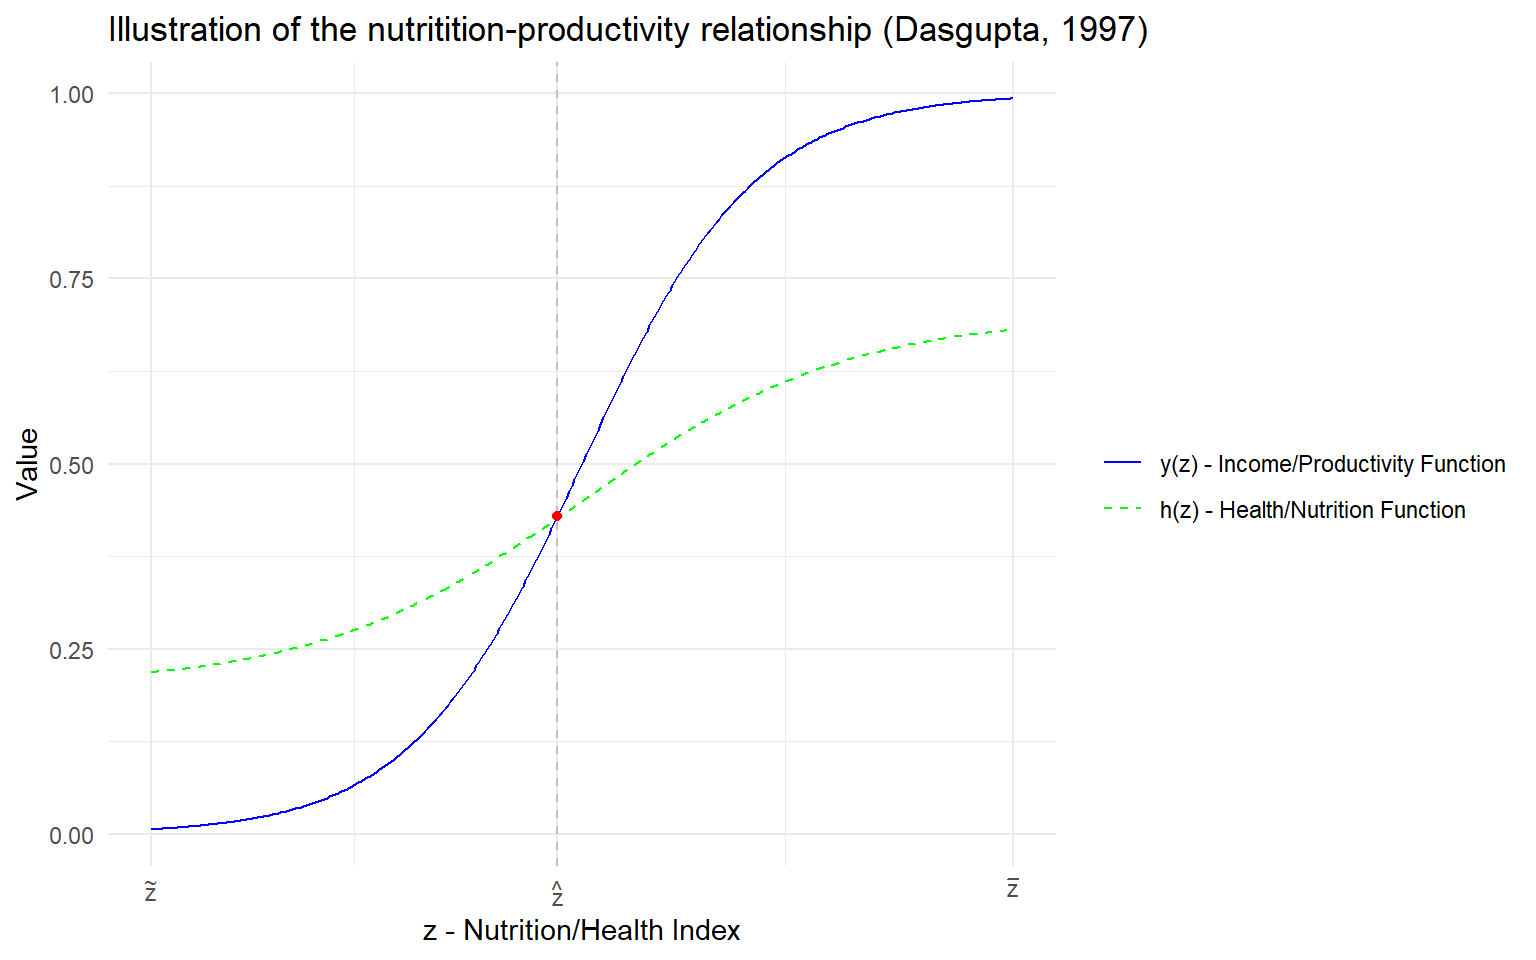
When Efficiency and Equity Cannot Be Separated
Inequitable access to financial instruments and efficiency
Small farmers and informal (small businesses) excluded from the formal financial markets
- \(\rightarrow\) these small farmers and businesses are inefficient because access to banks’ loans is not equitable
Inequitable access to insurance
- \(\rightarrow\) small farmers (businesses) tend to choose safer technologies, even when those are not efficient
Intergenerational effects
- Poverty and malnutrition (stemming from parents’s current circumstances) prevent kids from growing up to become productive adults (in the future)
Lack of infrastructure and limited flow of information
- \(\rightarrow\) segmented markets,e.g. excess supply and excess demand of the same good can exist in two geographically close areas
When Countries Develop
Social indicators improve
Health: Life expectancy, infant mortality
Education: Literacy, higher education
Structure of economy changes
Shift from agriculture
Expansion of markets
- Goods and services
Institutions develop and deepen
- Property rights, rule of law, etc.
Accelerating then decelerating population growth (the demographic transition)
Emigration to immigration (the migration transition)
Application of science to problems of production
UN Development Goals and World Bank Country Classification
UN Development Goals
The MGDs: Eradicating Extreme Poverty (2000-2015)
World Bank Country Classification
Four groups for the 2024 fiscal year, based on Gross National Income (GNI) per capita in 2022 using the World Bank Atlas method
Low-income economies, GNI per capita \(\$1,135\))
Lower middle-income economies, GNI per capita between $ $1,136$ and \(\$4,465\)
Upper middle-income economies, GNI per capita between \(\$4,466\) and \(\$13,845\)
High-income economies, GNI per capita of \(\$13,846\) or more.
The focus of this class (with few exceptions) is on low-income, lower middle-income and upper-middle economies
Elementary Statistical Methods
- When going through this course there are certain mathematical concepts that will be referred to repeatedly:
- Mean.
- Variance.
- Standard Deviation and Correlation.
- An ordinary least squares (OLS) regression and how to read the coefficients.
- Think about us wanting to look at the relationship between life expectancy and per capita income (the figure above)
- For each country, \(i\), we have the value of per capita income in that country, \(x_i\), and the life expectancy, \(y_i\).
- This can be written as an “pair” \(\left(x_i, y_i\right)\).
Elementary Statistical Methods
- The sample mean: \(\bar{x}=\frac{1}{n} \sum_{i=1}^n x_i=\frac{x_1+x_2+\ldots+x_n}{n}\)
- The sample variance is then \(V=\frac{1}{n} \sum_{i=1}^n\left(x_i-\bar{x}\right)^2\)
- The sample standard deviation contains information in the same way the variance does. That is because standard deviation, \(\sigma=\sqrt{V}\)
- The sample covariance of \(x\) and \(y\) is: \[ \operatorname{cov}_{x y} \equiv \frac{1}{n} \sum_{i=1}^n\left(x_i-\bar{x}\right)\left(y_i-\bar{y}\right) \]
- Then we can formulize what we mean by correlation with the coefficient of correlation: \[ R=\frac{\operatorname{cov}_{x y}}{\sigma_x \sigma_y}, \quad-1 \leq R \leq 1 \]
Elementary Statistical Methods
| Outcome \(X\) | \(X- \mu\) | \((X - \mu)^2\) | \((X - \mu)^3\) | \((X - \mu)^4\) |
|---|---|---|---|---|
| 1 | -3.5 | 12.25 | -42.875 | 150.0625 |
| 2 | -2.5 | 6.25 | -15.625 | 39.0625 |
| 3 | -1.5 | 2.25 | -3.375 | 5.0625 |
| 4 | -0.5 | 0.25 | -0.125 | 0.0625 |
| 5 | 0.5 | 0.25 | 0.125 | 0.0625 |
| 6 | 1.5 | 2.25 | 3.375 | 5.0625 |
| 7 | 2.5 | 6.25 | 15.625 | 39.0625 |
| 8 | 3.5 | 12.25 | 42.875 | 150.0625 |
| \(\frac{\sum}{8} = 4.5 \equiv \mu\) | \(\frac{\sum}{8} = 0\) | \(\frac{\sum}{8} = 5.25 \equiv \sigma^2\) | \(\frac{\sum}{8} = 0\) | \(\frac{\sum}{8} = 48.5625\) |
| Mean \(\mu \) | Simple deviations | St. dev \(\sqrt{5.25} = 2.291 \) | Skewness \(\frac{0}{\sigma^3} = 0 \) | Kurtosis \( \frac{48.5625}{\sigma^4} = 1.762 \) |
Linear Regression
- Suppose our regression results are the following: \[ \text { life }_i=20+0.25 * \text { income }_i+0.02 * \text { averagetemp }_i-0.30 * \text { disease }_i \]
- If income was measure in units of \(\$ 1\) and life expectancy was in years, what would the coefficient 0.25 mean?
- A \(\$1\) increase in per capita income will increase life expectancy by \(0.25\) years.
- If income was measure in units of \(\$100\) and life expectancy was in years, what would the coefficient 0.25 mean?
- A \(\$ 100\) increase in per capita income will increase life expectancy by \(0.25\) years.
- How does one interpret the \(-0.30\) on the disease coefficient?
- A 1 percentage point increase in the number of people who have a disease will decrease life expectancy by 0.30 years.